Anatomy of a Gas Price Spike – Why Are Gas Prices So High in California? Part II

la-fi-gas-prices-20150713

Rumors in the gas market sent gas prices soaring in the LA area in July 2015. (Courtesy: LA Times)


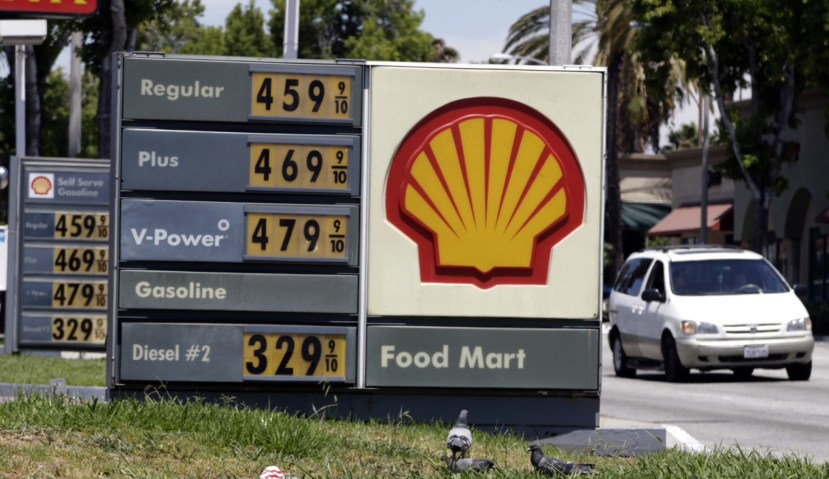
In July 2015, gas prices in LA shot up overnight. Some stations downtown posted prices as high as $4.99 a gallon.

“I’m mad as hell,” one driver fumed to a reporter for the Los Angeles Times as he pumped $4.65 gas into his car. “What can you do? It’s crazy, man. It is crazy.”

They had right to be angry. Gas should have been cheap. Oil prices tumbled 50 percent  over the previous 12 months and were down around $50 a barrel.

Nobody really seemed to have a clue what sent Los Angeles gas prices soaring 70 cents over that Fourth of July weekend. That’s just how things go in California, experts said.

The story of what happened in Los Angeles emerged at a hearing this month before the Petroleum Market Advisory Committee, which has been trying for two years to explain the nature of such price spikes.

The LA gas price spike offers a window into the hidden world of gasoline trading in California. The picture that emerges is of a thinly traded gasoline market that is not for the faint of heart. Rumors precede facts and whip up wild price swings that can turn a sure bet into a big money loser in an instant.

The LA gas spike is evidence that California’s gas market “is prime to being manipulated and is being manipulated,” said Bob Van Der Valk, senior editor of Baaken Oil Business Journal, who told the story to the Petroleum Market Advisory Committee.

The West Coast used to be one of the best markets in the world for gasoline importers. It was a huge market. It was the most populous state in the country after all. Almost everyone, especially in Southern California, got around by car.

But over the past 15 years, as California imposed more and more environmental rules, that has changed. Huge trading outfits with deep pockets and resources like Glencore, Vitol and Trafigura have walked away from California, said Dolores Santos, who traded fuel for nearly 40 years in the state before joining the Oil Price Information Service. Today, only a handful of gasoline traders are left.

There is a saying among traders: Buy on the rumors and sell on the facts. And the rumor in July 2015 was that the Exxon Mobil refinery in Torrance, California, just outside LA, was about to come back on line.

la-me-ln-exxon-mobil-refinery-blast-20150223

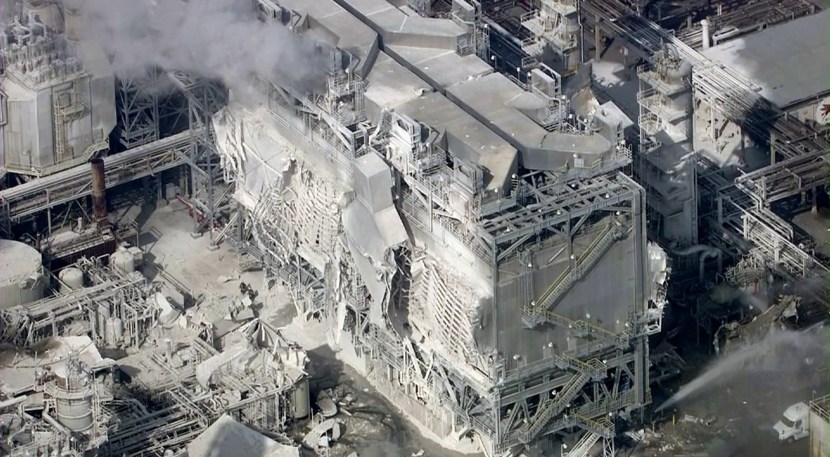
Exxon Mobil’s Torrance refinery damaged by an explosion in February 2015. (Source: LA Times)

The Torrance refinery produces 1.8 billion gallons of gasoline per year, or about 8 percent of the state’s supply. A massive explosion had ripped through the refinery in February, instantly cutting off critical supplies of gasoline. The resulting shortage had sent Southern California prices soaring in successive waves.

To make up for the lost supply, traders had been buying up gas from refineries in Singapore or India, shipping it to California, and selling it on what is known as the “spot” market. A cargo full of gas had been arriving in the Port of Los Angeles every three days on average. That had helped alleviate some of the strain.

But the rumor making its way around California’s small gas trading community was that the big Exxon Mobil refinery would resume operations July 15. That would alleviate the strains in Southern California’s gas market. There would be no need for imports.

Except it wasn’t true. The Exxon Mobil refinery would not resume operations until September.

The rumor carried the day, however, not the facts. It chased away cargoes of gasoline even the spot price at the time was good enough to attract imports.

Supplies were pretty tight in Southern California around the Fourth of July. And that’s when some big gas refiners stepped in to do something that drove prices even higher.

Two big oil companies had gone out and bought every barrel of gasoline available on the spot market,  Bob Van der Valk told the Petroleum Market Advisory Committee this month. Van der Valk, who got the story from gas traders he knows from years of covering the energy business,  wouldn’t say which companies were responsible.

“The last desperate step for a major is to go out in the spot market,” he said. “They know full well when they do they’ll drive up prices.”

If this is true, then it confirms all the bad things that people say about oil companies.  Consumer advocates have long believed believe that the players in the state’s gas market have used “market power” to drive up prices by curtailing supply in times of shortage. That’s exactly what happened in July.

The gas price spike allows refiners to make extraordinary profits but they don’t last long enough to prompt changes in demand. If gas remained at $5 or higher year after year, you would see a rise in the use of public transportation, fewer cars on the road, and higher sales of more efficient vehicles. But gas price spikes don’t last much longer than a few weeks, so all people can do is shake their fists and hand over their wallets.

There are two factors that give refiners enormous leverage in California:

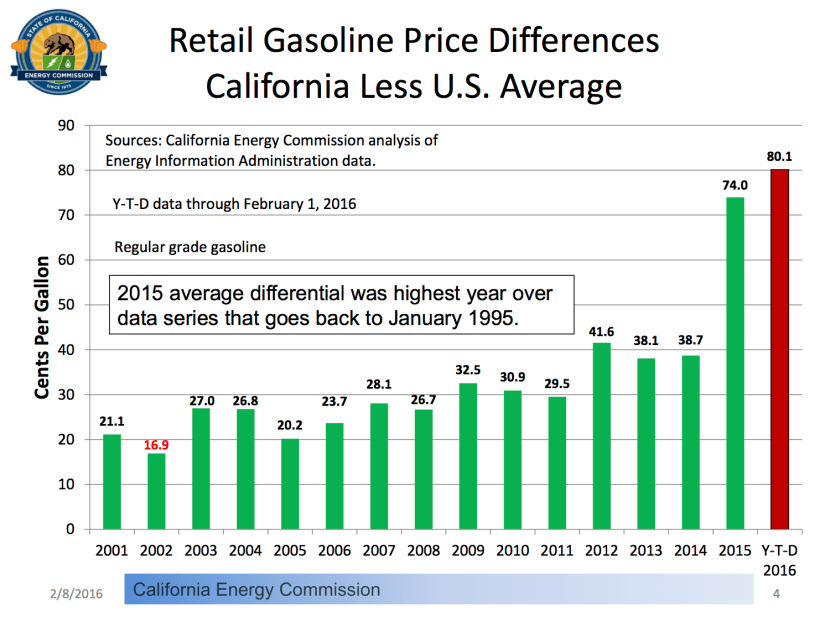
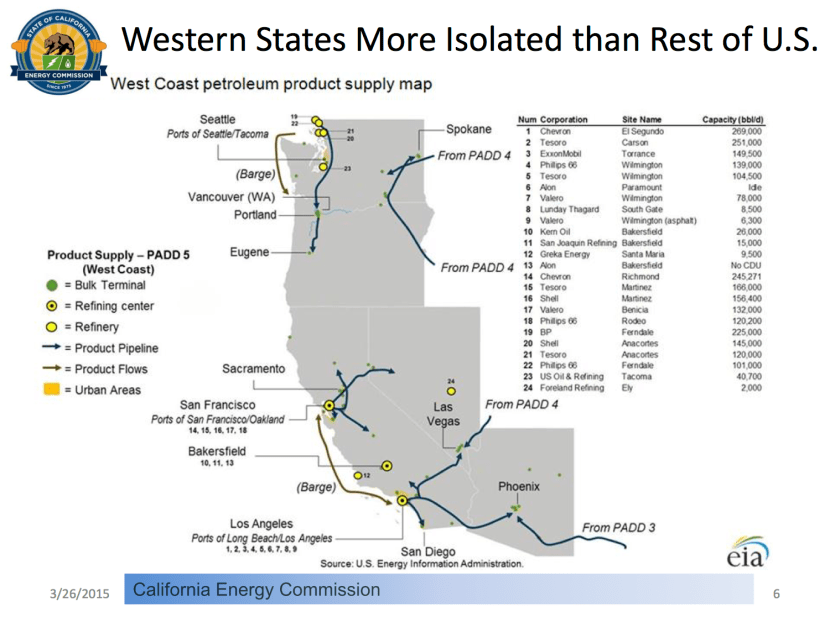
  1. California’s gas market is isolated from the rest of the country. (See my previous post on Why Gas Prices Are So High in California – Part I)
  2. Whether you are rich or poor, whether gas is cheap or expensive, people still buy the same amount of gas.

There are nearly 29 million cars in California. Most people have to drive to get where they are going. In economic terms, it’s “inelastic” demand.

California’s gas market is an oligopoly, dominated by a few firms. Two companies produce half the gasoline in the entire state. In San Diego, where I live, Tesoro — through its USA Stations, Arco and some Shell stations — controls 40 percent of the market.

2014_gasoline_marketshare

If I had to guess which company bought up the available spot supply in July, my money would be on Tesoro.

Keith Casey, Tesoro’s executive vice president of operations, told analysts and investors on Dec. 9 that the company had made millions on LA gas price spikes in 2015:

…in 2015 we had very strong product demand in California, and we move about 50,000 barrels a day of intermediates and blendstocks across our system, and through our movements of octane to support that demand in southern California from the rest of our system, we made about $15 million to $20 million being able to supply that and optimizing from the entire system.

Here Tesoro is effectively saying that we able to make $15 to $20 million selling gas quickly in Southern California during times of shortages. And of course the July shortage may have been made worse by the oil companies themselves.

Tesoro has built a business around these price spikes in Southern California. The company can quickly switch between gasoline and diesel production to take advantage of volatility:

And that’s why we believe flexibility and agility are really the key for competitive advantage. Importantly, our swing capability, which we have driven this 10% capability of our production to swing, is incredibly agile. We can often execute that in less than one 12-hour operating shift to meet the market demands.

Since 2010, this volatility has earned Tesoro $8 a barrel on average. During extreme price spikes Tesoro can earn as much as $60 a barrel, according to Casey. Since there are 42 gallons a barrel, this means Tesoro is earning as much as $1.42 per gallon of gasoline sold. That’s huge.

Whether Tesoro is artificially raising prices in California isn’t clear, but the company is certainly rewarded if it does. As Tesoro’s CEO Greg Goff put it, 2015 was “somewhat of an exceptional year, particularly in California.”

Why Are Gas Prices So High in California? Part I

Gas is cheap these days. Since 2014, the average price of a gallon of gas in the US has been cut in half to $1.70 and is headed still lower.

Except in California. A gallon of gas is $2.42 on average here. That’s more than 70 cents above the US average.

People in California are so used to paying more that this is seen as good news. Gas prices topped $4 in Los Angeles in the summer of 2015.  So Californians are celebrating, not realizing that they are still paying more than the rest of the country.

Expensive is now normal in California. In 2015, a gallon of gas sold at the pump cost 70 cents above the U.S. average, according to the California Energy Commission. And for the month of January 2016, gas prices were 80.1 cents above the national average. That’s huge.

Gordon_Schremp_presentation

A difference of 70 cents may not sound like much, but multiply that by the 14.9 billion gallons of gasoline consumed in 2015 by drivers in the nation’s most populous state.

The number gets a lot bigger.

California drivers paid a whopping $10.4 billion more for gasoline in 2015 than the US average. Wow.

Why is this so? The reason frequently given is the state’s higher taxes and strict environmental regulations drive gas prices higher.

  1. California requires the world’s cleanest burning gasoline, which is more expensive to refine. Cost: 10-15 cents more per gallon.
  2. Anti global warming regulations add a pollution tax on refineries. Cost: 10-15 cents more per gallon.
  3. Gas taxes are higher in California. Cost in 2016: 10-15 cents.

So taking the low and high of these estimates (which like most of the information used in this post come testimony before a state panel) we get either 10+10+10 or 30 cents or at the high end, 15+15+15 or 45 cents. That accounts for less than half to two-thirds of the 70 cent-per-gallon difference between the average U.S. gas price and California’s.

Where does the other 25-40 cents go?

This, it turns out, is a vexing question, one that a state panel, the Petroleum Market Advisory Committee, has been trying for two years to answer.

Simply put, there isn’t enough gas supply to meet demand, especially in Southern California where most of the state’s population lives. That drives the average price of a gallon of gas higher.

In a properly functioning market economy, scarcity of gasoline, a widely available commodity, should serve as a signal to competitors. There’s money to be made selling gas in California! Competitors arrive with gas to sell. The supply increases until prices gradually fall back to normal.

But that’s not happening. Gas isn’t pouring into California, so prices remain stubbornly high.

The reason why is a bit surprising: A lot of it has to do with geography.

In old 16th and 17th European maps California was depicted as an island. In terms of gasoline, California is an island.

Almost all of California’s gasoline supply is produced inside the state by 13 refineries. And this put the state’s drivers at a major competitive disadvantage.

When everything is working smoothly, these refineries can supply enough gas to meet demand. In fact, California exports gasoline to Nevada and Arizona.

However, things don’t always work smoothly. Refineries break down or catch fire and the sudden shortage can cause prices to shoot up.

Gas prices have remained persistently high in Southern California since an explosion shut down Exxon Mobil’s Torrance refinery in 2015. The Torrance refinery produced somewhere around 10 percent of the state’s gasoline supply.

la-me-ln-exxon-mobil-refinery-blast-20150223

An explosion at an Exxon Mobil refinery in Torrance in February 2015 has resulted in higher prices in Southern California. (Courtesy LA Times).

Outside California, when refineries hut down for routine maintenance or unplanned outages, drivers often don’t even realize it. Other refineries quickly make up the difference.

Take Florida. While California produces all its own gasoline, Florida is the opposite extreme. Florida has zero refineries. It is totally dependent on imported gas. So what does gas cost there? $1.75, a few pennies the national average.

Like most of the country, Florida gets its gasoline via pipeline from the Gulf region. The U.S. Gulf region is a giant gas exporting machine. Texas and Louisiana together account for half of the gasoline refining capacity for all of the United States.

Pipelines can move gas from Texas as far away as New York, but they don’t reach California. (Exactly why this is so is unclear, since a Gulf pipeline could reach Los Angeles through Arizona and New Mexico.)

Pipelines do link California to Nevada and Arizona, but the gas flows only in one direction: out of the state. Gas flows from the Bay Area to Northern Nevada and from Southern California to Las Vegas and Arizona.

If you look at the chart below, you’ll see that the arrows all point east. Also note there are no pipelines linking Northern and Southern California. This is another big problem.

Petroleum.png

Well, can’t ships bring gas to California to alleviate shortages?  Why not ship gas from the Gulf to California in times of shortage?

California’s geography works against it. Outside California, there are only a few refineries  in the world that produce gas known as CARB that meets the state’s strict standards. They are all far away.

The closest refinery that produces CARB gas is in the Gulf. It takes 10 days for a tanker from the Gulf to pass through the Panama Canal and reach California.

Due to a quirk of US law, it’s actually more expensive to ship gas to California from the Gulf than from refineries in Asia, even though the voyage from Asia is twice as long. It costs $10 per barrel to ship gas from the Gulf Coast to Los Angeles vs 6 a barrel from Asia.

Under a law known as the Jones Act, ships that sail from one U.S. port to another must be made in the USA and at least 75 percent of the crew has to be American citizens. There are very few Jones Act ships left.

It’s so hard to find a Jones Act ship that gas cannot easily move around even inside California. As noted earlier, there are no gasoline pipelines linking Northern California with Southern California.

At a hearing this month before the Petroleum Advisory Market Committee, an industry analyst noted that gas was 30 cents cheaper recently in Northern California than Southern California. But there was no way to move the gas south.

Few ships and no pipelines mean California’s gas market is isolated from the rest of the country. And this is the real reason why gas is much more expensive in California than the rest of the country.

We here in the Golden State are totally dependent on in-state refineries.

That doesn’t sit well with some people.

This concentration of power has given rise to charges that refiners are using market power to drive prices — and their profits — higher. We’ll take a look at this in our next post.

Facing a Big Decision? Math is Your Friend.

How do you make the big financial decisions in life?

Many people, if not most, can make these decisions by trusting their gut.

If that’s you, well, I envy you. That doesn’t work for me. I will be waking up in the night in a panic with my heart pounding, wondering if I’m doing the right thing.

I trusted my gut when I bought my first (and only) house after deciding “It just feels right.” For the next year, I was convinced that when I left for a trip the whole thing would collapse in my absence.

After that, I realized I needed to base my decisions on some reason, weighing the cost against the benefits.

For some things it’s a no-brainer. The benefits of having a car here in Southern California far outweigh the cost, so we didn’t think too much about that one. But what about something that’s no so clear cut? I know I keep blabbing on about solar, but it’s a good example of an expense where the costs are high and benefits are less certain.

It’s time to break out the math. But stay with me. Thinking deeply about money in our daily lives can provide enormous insight into the world around us.

So, we want to be able to compare at the cost of the solar system to what we would be saving in electricity. Here’s what we spent on electricity in the last year:

One way to look at this is to figure out how many years of electricity bills will it take to pay for my solar system. My solar system will cost $14,700 after taxes. I spent $1241 on electricity last year. So my payback will be:

Net cost of solar system/annual electricity bill=12 years

If you want to stop there, fine. But if this strikes you as too simple, good for you! It doesn’t account for change over time. My solar system is supposed to last 30 years and a lot of things will change in that period.

For starters, my utility bill isn’t going to stay the same over the next 30 years. Not a chance! But how much will it rise? The Energy Information Association estimates that residential power bills will rise 2.5 percent a year through 2040. Applying that, my power bill will steadily rise until 2045 when it will be $2,540.

So that $2,540 is money I’m not spending since I’ve gone solar. I can spend it on whatever I want (or save it). So my solar system has freed up cash for my household for the next 30 years. If I were a business, I would call this positive cash flow.

Utility rates aren’t the only thing changing over time. What also will be changing is the value of the dollar. Inflation has been quiet of late but over the next three decades, it will rise again. In fact, there’s a chance it may come roaring back.  In 30 years, a dollar will be worth less than a dollar today.

So how do we deal with all this change over time?  The answer is a concept known as net present value (NPV).  This is a very useful concept because once you understand it, you can use NPV to analyze all sorts of investments like stocks or bonds.

Here is a video that explains the concept in three minutes:

The rule is if your NPV is less than zero, it’s a bad deal. A net present value that is positive means that my solar project or any investment will save me more money than it costs.

It takes a bit of work to figure out net present value. You need to know how to use a spreadsheet, but it gives a much more accurate insight into whether an investment is worthwhile. When I’m spending $21,000 that matters!

Net present value accounts for the changing value of money over time. A dollar is worth slightly less next year than a dollar today. But how how much less? To calculate this, we need a rate of return. I used the 30-year Treasury bond rate, which as of today is 2.8 percent.

NPV is calculating interest in reverse. Let’s start with the interest calculation: If we bought a 30-year bond for $1000 today, next year it would be worth $1000*1.028 or $1,028.

Let’s look at it backwards. How much is a 30-year Treasury selling for $1,028 next year worth today? The answer is $1,028/1.028 or $1,000. Can you guess the NPV of the same bond selling for $1,056 in 2018? It’s $1,028/(1.028*1.028) or  $1,000.

Excel and Google spreadsheets have an NPV function that makes calculating this easy. I applied this to my column of electricity bills growing 2.5 percent a year and subtract the cost of my solar and I get a net present value of $19,705. That’s the amount my solar system is saving me over the next 30 years! That’s way above zero, which means it’s a good deal.

There’s still one more way of looking at my solar system. It’s called Internal Rate of Return (IRR). Mathematically, it’s very close to NPV.  We assume the NPV is zero and then solve for the rate of return. The IRR for my solar project is 11 percent. An investment that returns 11 percent a year? I’ll take it!

Both net present value and internal rate of return are very powerful tools that allow you to cut through a lot of B.S.  Someone offers you an annuity that generates $2,000 a year, guaranteed. Is that a good deal?  Renting a house and deciding whether to buy one? Now you can decide with some greater precision.

In fact, net present value is the secret weapon of stock guru Seth Klarman  who praises it as a powerful analysis tool in his famous (in Wall Street circles) book Margin of Safety. Klarman writes, “When future cash flows are reasonably predictable and an appropriate discount rate can be chosen, NPV analysis is one of the most accurate and precise methods of valuation.”

How can this be used to pick stocks? We will cover the applications of NPV for stock analysis in our next a later post.

Is Net Energy Metering a Subsidy for the Rich?

Benjamin Zycher at Forbes thinks so.

So what’s the problem? First, the credit paid in California for the excess solar power is far higher than the cost of alternative electricity sources, usually from utilities or from the spot power market. Consumers without such solar installations have to finance that excessively expensive electricity, so that overall power prices are forced above the level that would prevail in the absence of the net metering system. This system, by the way, subsidizes the affluent (median income of those installing solar systems: $91,210) at the expense of all other power consumers (median of $67,821), an embarrassing reality from which the supporters of the net-metering system prefer to avert their eyes.

Second, reliability is a hugely valuable attribute of power systems; no one likes blackouts. Electricity bills reflect the cost of that reliability in the form of “capacity” charges, that is, the part of the bill covering the cost of the physical system and its spare capacity, before fuel expenses and other such generation costs. People who install solar systems benefit from the reliability provided by the grid–they consume conventional power at night and at other times that the sun fails to shine–but because they pay only for their “net” power consumption, they get a free ride on the cost of the generation equipment and other capital that yield the reliability upon which they depend. The problem is that the free ride is not free: Other consumers have to pay for it.

Let’s take those one by one.

The idea behind net energy metering is that my demand for electricity and the solar electricity I supply to the grid cancel each other out. During the day, the power generated by my rooftop panels that I don’t use flows into the grid. At night, I am given a credit for the electricity I supplied during the day.

Perhaps Dr. Zycher has forgotten that solar panels are a source of energy that the utility has paid nothing to produce. Here in San Diego, solar panels generate more than 500 megawatts of electricity. In all of California in 2014, solar generated 10,557 gigawatt hours of electricity.

Would Dr. Zycher have me pay for the privilege of supplying electricity into the grid?

If my solar panels generate more power than I consume, I am paid at the wholesale spot market electricity price. I fail to see how this is “excessively expensive” and drives up power prices, as Dr. Zycher asserts. If anything this power is significantly less expensive for the utility, since the power is instantly in the grid, and the utility does not have to haul this energy long distances as it does with other sources of power.

The second point Dr. Zycher makes about reliability is more grounded in fact. It is true that under net metering, solar users don’t pay the full costs of maintaining the grid. This cost is passed along to other non-solar customers. Dr. Zycher is correct in pointing out that is unfair, and the costs should be borne equally by all grid users. San Diego Gas & Electric has estimated these costs at $100 per year. It would be a simple matter to pass this fee along to solar users.

There are genuine subsidies in solar. The cost of installing solar panels is subsidized by U.S. taxpayers, and we can debate this all day. Do we really need solar subsidies? I believe that all subsidies distort price signals. Watch what happens to solar when the tax credit goes away.

Net metering, however, is no subsidy. Rather it is an accounting system that balances supply and demand. Solar may not work everywhere, but it sure makes sense in California. Doing away with it will unfairly doom  a pollution-free source of energy that is delivering a reliable supply of power on sunny days when demand in the Golden State is at its peak.


How I Chose My Solar Installer

These are boom times for the solar industry. There are no shortage of choices for  installers.

I wound up going with a company called Jamar Power Systems. I was very satisfied with the work they did for the price they charged.

Here are some lessons I learned in choosing them.

  • Don’t pay for a company’s sales and marketing. Jamar relies almost exclusively on word-of-mouth. Companies with big marketing budgets like SolarCity charged more because customers have to pay for the advertising.
  • Look closely at the cost per watt. You will get bids for slightly different size systems and cost per watt is a way to compare them. A fair price for a solar installation is $3.50 per watt for installing the panels and inverter (which coverts DC solar power into AC current that can be used in your home). This is what Jamar charged.
  • A company that only does solar may not be around in a couple of years. Jamar has been around since 1984. They do a good business in commercial and residential electrical projects and they are likely to be around when the solar wave crashes.
  • Think carefully about the upsell. Many installers recommended Sunpower panels, which are considered the best in the business, the Mercedes of solar panels. Like Mercedes, you pay more. I went with panels made by LG that carry a 25-year warranty. Sunpower panels would have cost 10 percent more, and I didn’t feel they were worth the cost.
  • Optimize per panel power generation. A disadvantage to Sunpower panels is that they are often paired with Sunny Boy inverters. While Sunny Boys are well made, they are a bit behind the times. Newer technology allows solar panels to produce more by optimizing the panel when one or more of the panels is in shade. If you have big trees in your backyard like me, this is very helpful. My inverter is made by Solar Edge and it allows me to maximize the power my panels can generate.

Was there anything I didn’t like about Jamar?

They didn’t send someone out to my house until I signed a contract. This bothered me until I met the excellent who worked for them. I suppose they do this to keep costs down.

A final word: Do your homework. Check Solarreviews.com, yelp.com, and look up the contractor’s license in your state to check for any problems. For technical help, check www.solarpaneltalk.com